End-of-Year Highlights
A look back to 2025's most popular charts.

As 2025 draws to a close, we’re continuing our annual tradition of reviewing the most popular charts we published this year. These charts span the political, financial, economic, and cultural worlds, and were the ones you all shared with your networks the most in 2025.
January
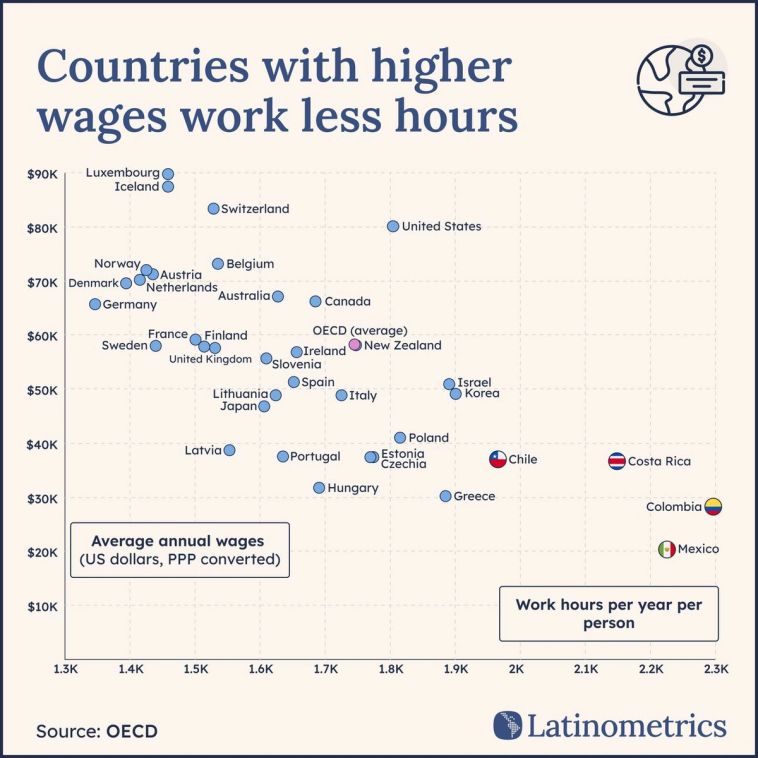
To kick off this year, we looked at work-life balance by plotting out annual hours worked versus wages. What’d we find? Well, despite working more than in (almost) every other OECD member country, Mexican workers earn the least across the organization.
February
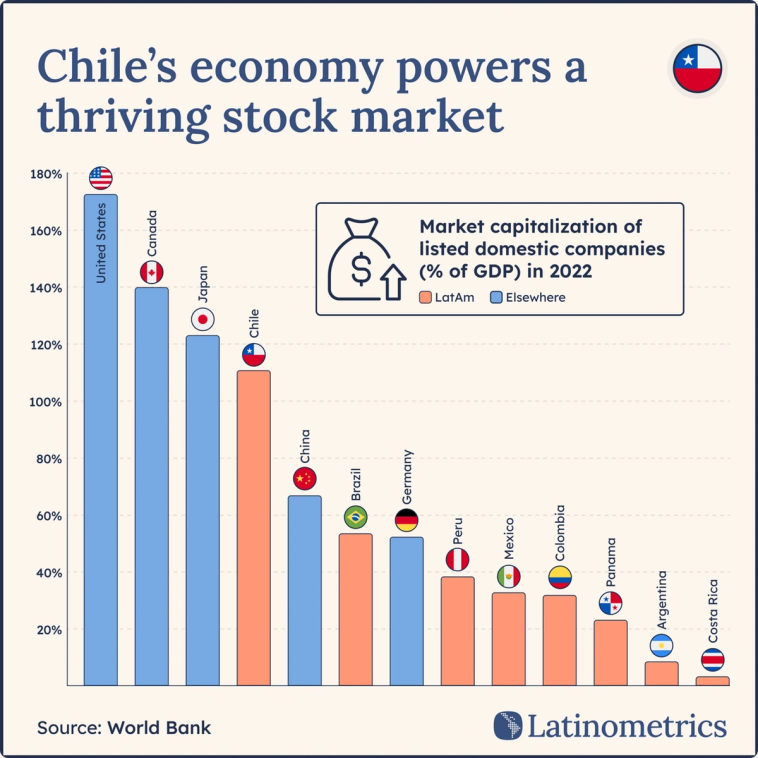
This was a whirlwind year for global equities, so we decided to track Latin American stock exchanges. Chile serves as a bit of an outlier in that its publicly-traded domestic companies have a combined market capitalization greater than its GDP—leaving it in pleasant company such as Japan.
March
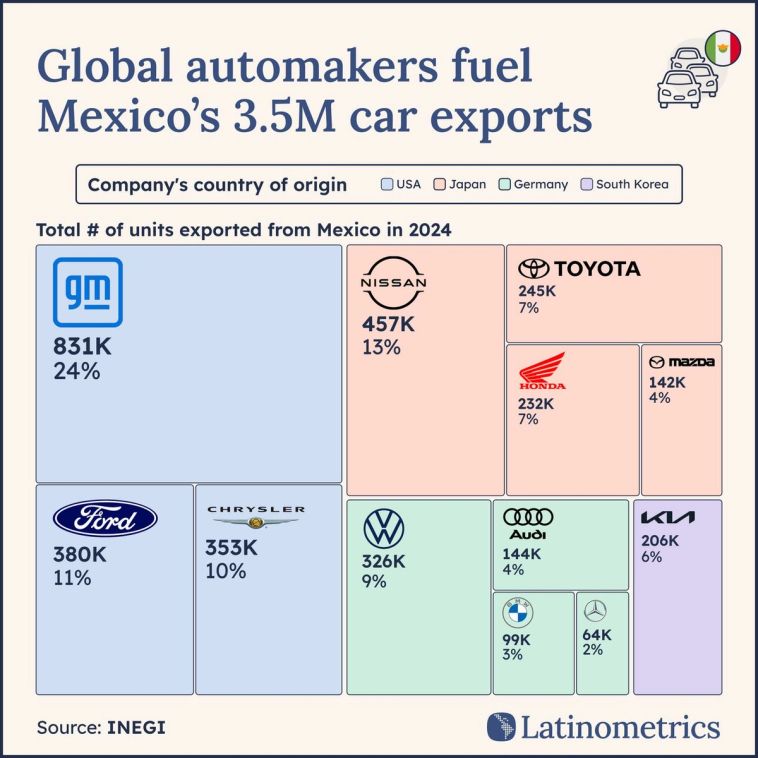
As trade tensions spiked in North America, an analysis of the Mexican vehicle industry revealed that the Big 3 US automanufacturers – Chrysler, Ford, and General Motors – were the largest car exporters in Mexico, undercutting the idea that foreign firms are the only ones hurt by import tariffs.
April
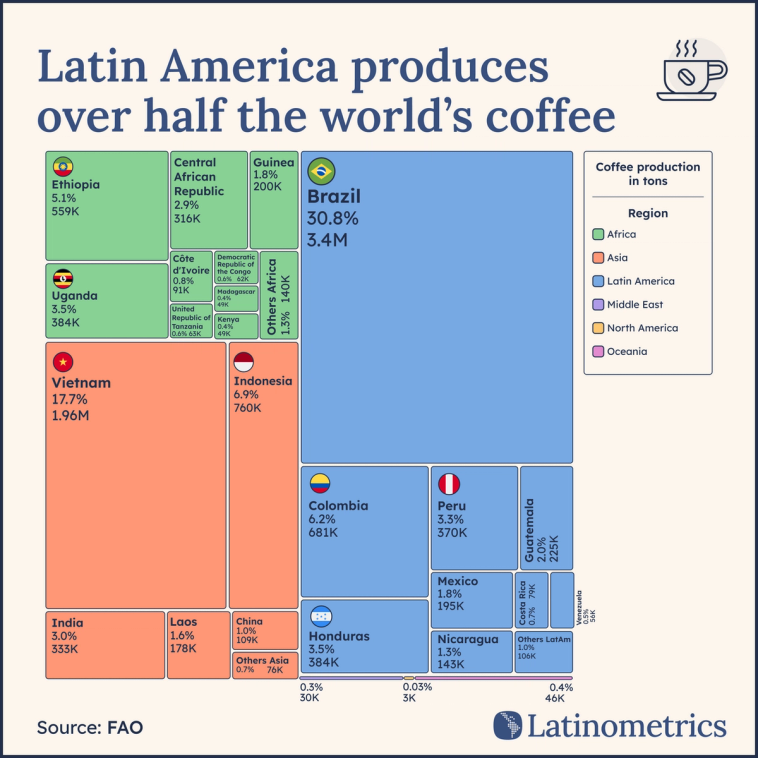
If there’s one thing people tend to love, it’s commodity charts. Some would say Latinometrics first made its bones on the back of pineapple or blueberry charts, and our coffee chart this year was no exception. We loved unpacking the way in which Latin America is maintaining its lead over other world regions in terms of production—and we especially loved seeing you all argue in the comments about why your coffee was superior to others’.
May
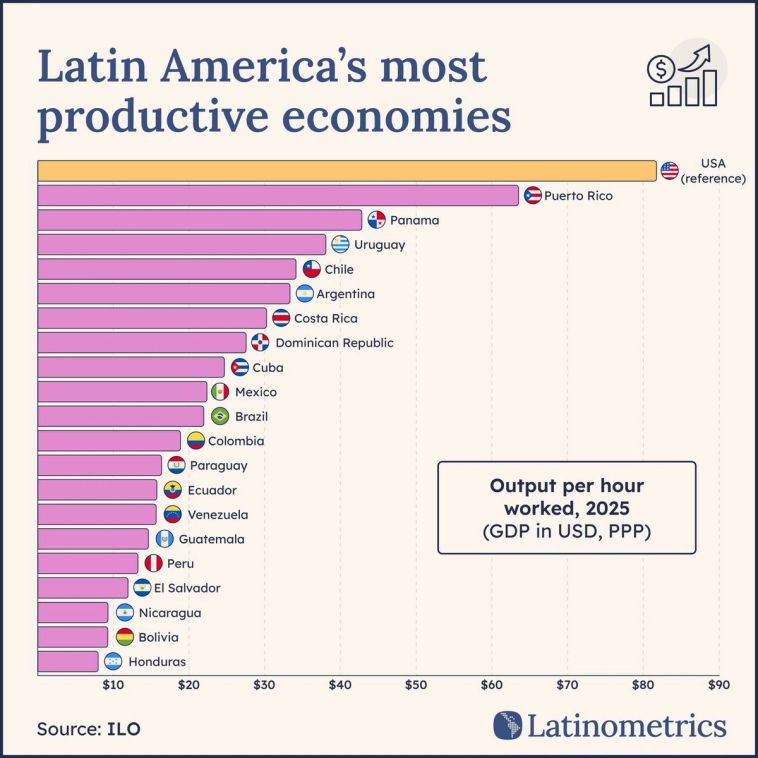
While we got some flack for our reported results on Cuba (blame the numbers, not us), this chart on productivity across Latin America served as an interesting lens into the countries driving high per-capita output—and those falling behind. Perhaps most intriguing is Puerto Rico’s high position, a likely relic of its unique development path as a US territory.
June
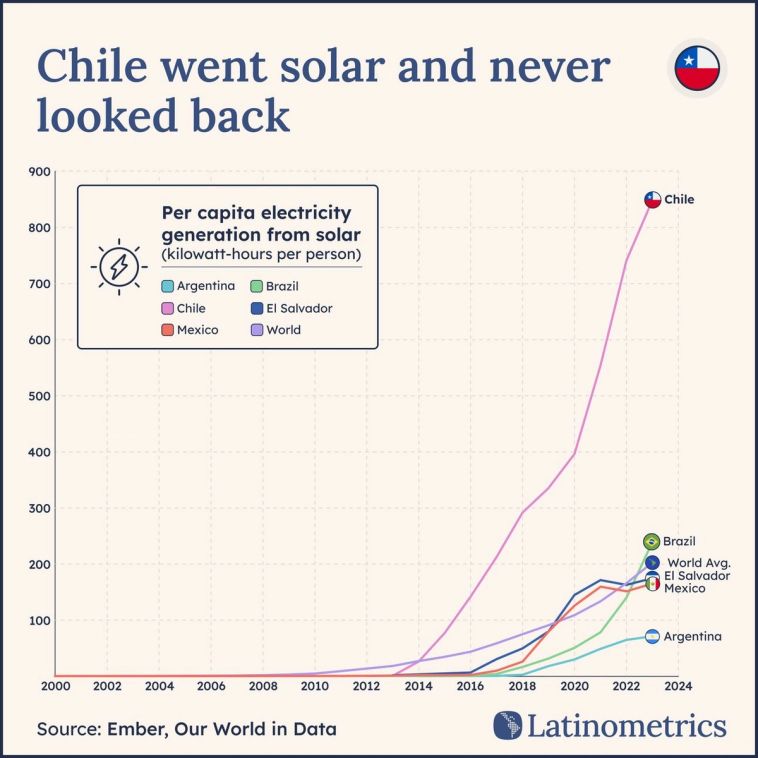
In keeping with the tradition of highlighting success stories, Chile eked out another win as the clear solar champion of Latin America. Electricity generation from solar energy has skyrocketed over the last decade, aided by a 100-megawatt photovoltaic solar plant in the Atacama Desert, which has more solar potential than anywhere else in the world.
July
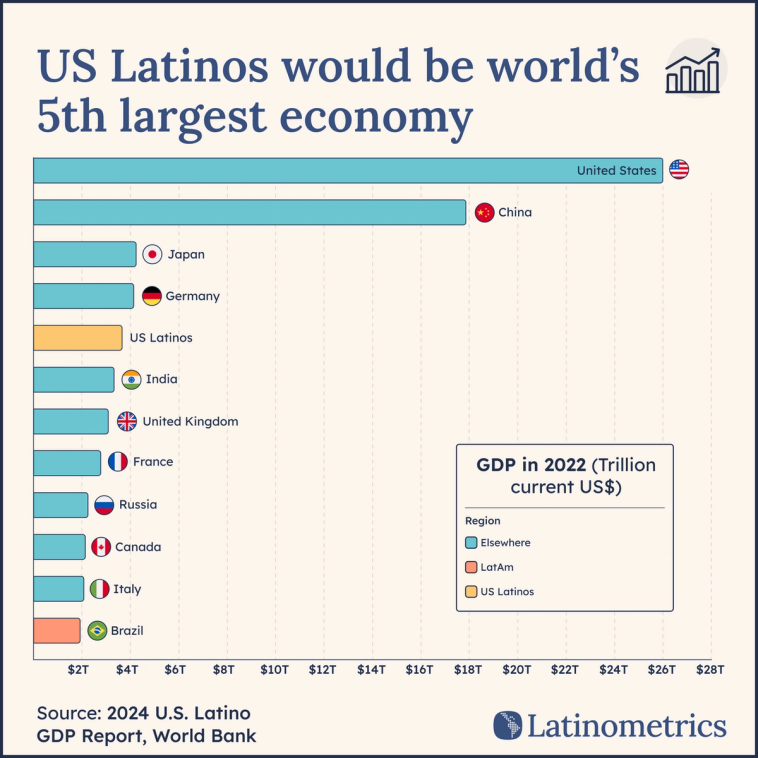
By far the chart which gets us the most love at events across the United States, this macroeconomic chart holds up the 65M Latinos living in the country and treats them as the serious economic bloc and consumer base that they are. Minority or not, the Latino demographic in the US towers above the GDP of any country in Latin America, as well as most around the world.
August
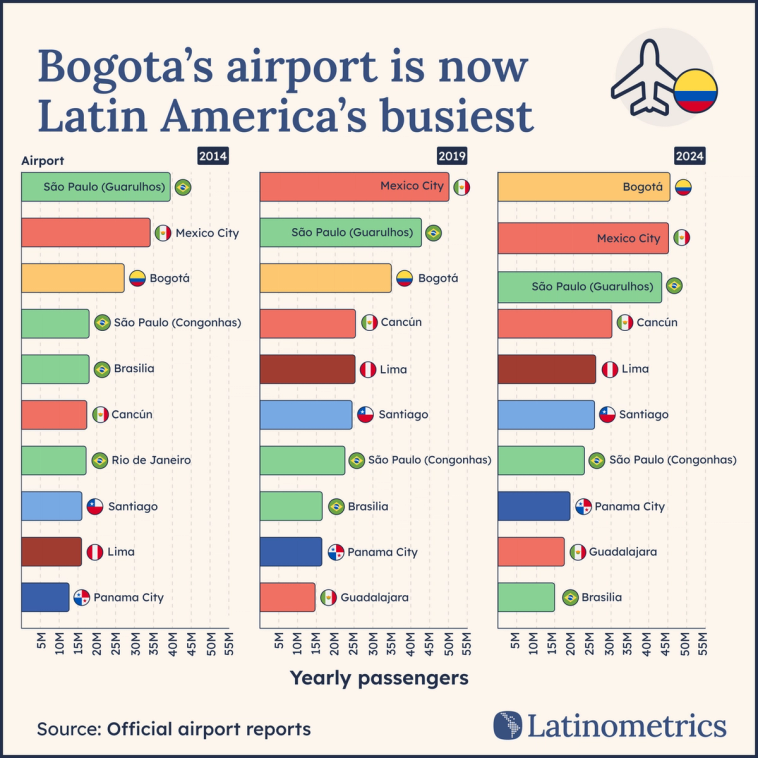
By all accounts, Colombia is the heart of Latin America, blending together Pacific and Caribbean coasts at the doorway to South America and with a piece of the Amazon rainforest no less. While this may hold fewer benefits than, say, sitting on mountains of lithium, the country’s central position has helped its capital city’s airport surpass Brazilian and Mexican competitors to become Latin America’s most-visited airport.
September
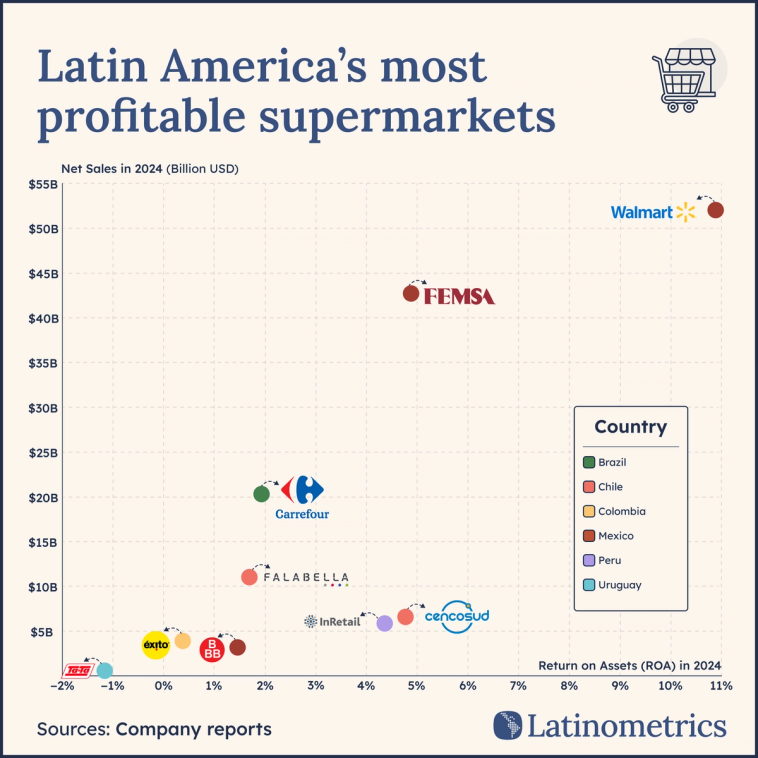
The supermarket game is serious stuff across Latin America. FEMSA is opening four new OXXO locations per day, yet is outperformed in terms of sales and return on assets by Walmart. In Brazil, meanwhile, the local subsidiary of French multinational Carrefour serves as the country’s biggest private employer, counting over 150K employees nationwide.
October
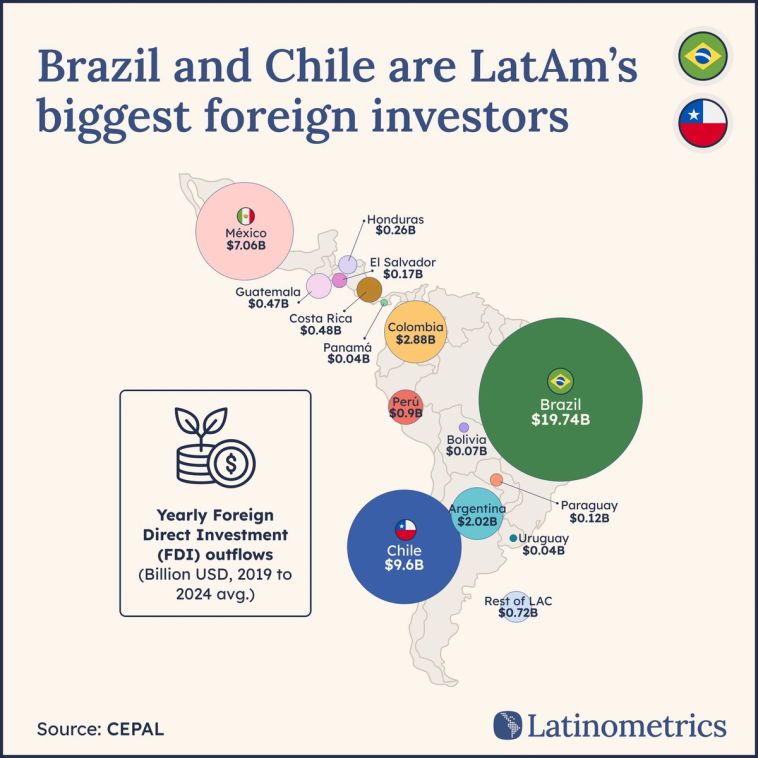
Fed up with people only ever talking about Latin America as an investment destination, we decided to switch things up by taking a look at FDI outflows. Once again, Chile is the success story, as institutional strength and macroeconomic stability have led to Latin America’s fifth-largest economy averaging over half the annual outflows of a far larger country like Brazil.
November
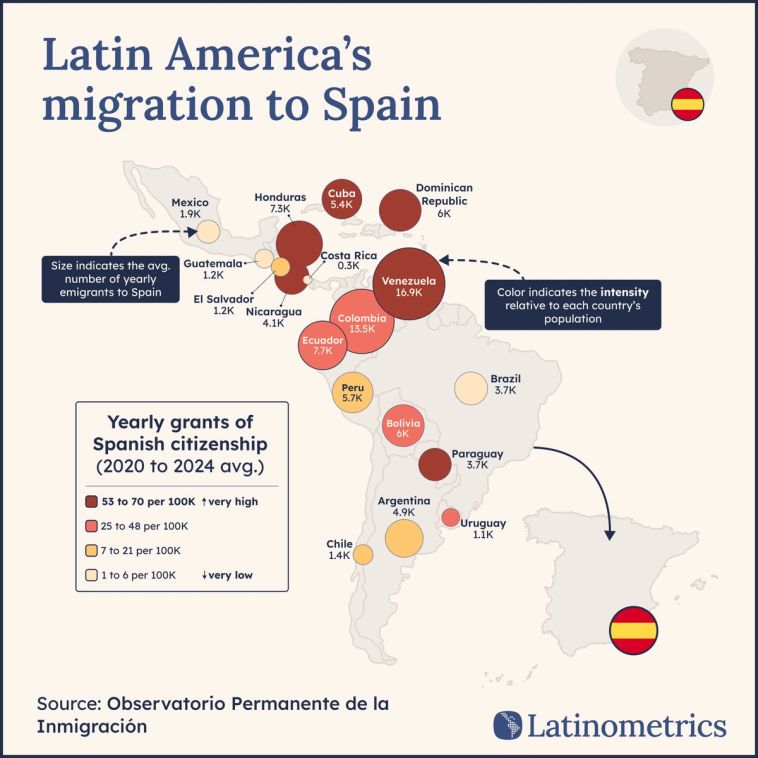
Migration is never not a hot topic for Latin America, and this year was no exception to say the least. Instead of looking at the oft over-explored US border, we chose to analyze the tens of thousands of Hispanics – and even some Brazilians – seeking Spanish citizenship.
December
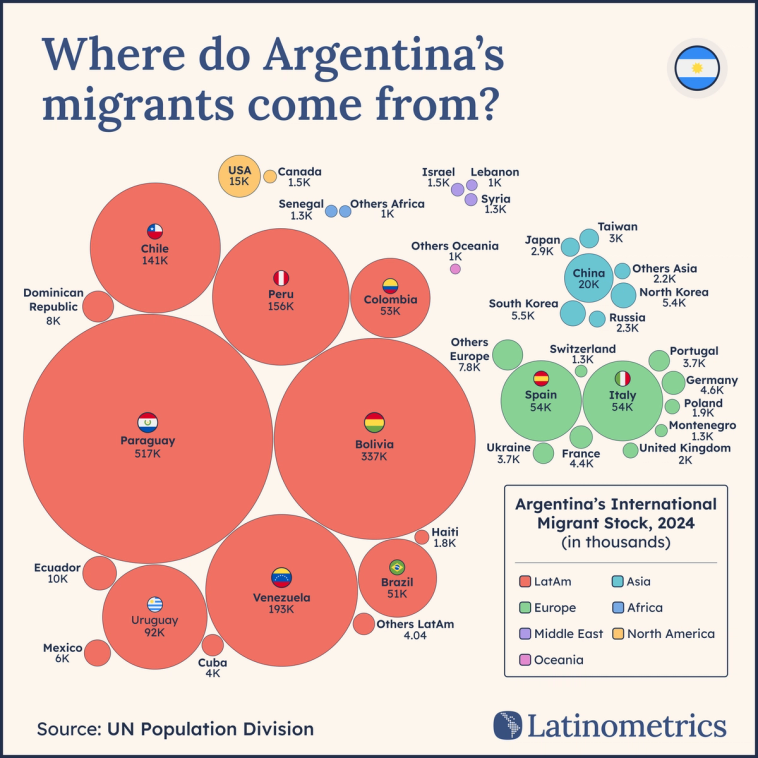
In keeping with the immigration focus, our biggest chart this month was about the international migrant stock of Argentina, which has welcomed over a million foreigners and over half a million Paraguayans in particular.
On behalf of the entire Latinometrics team, we thank you for your continued support and interest in our charts. Happy holidays, and may you continue to Visualize Latin America’s Potential.


