
C-suite readers engage with our charts 68% more than everyone else.
We turn what you know into charts Latin America's leaders share.
No commitment. We come with chart concepts for your brand.
Brands that turned data stories into pipeline
Each one started as a client's expertise, not a press release.
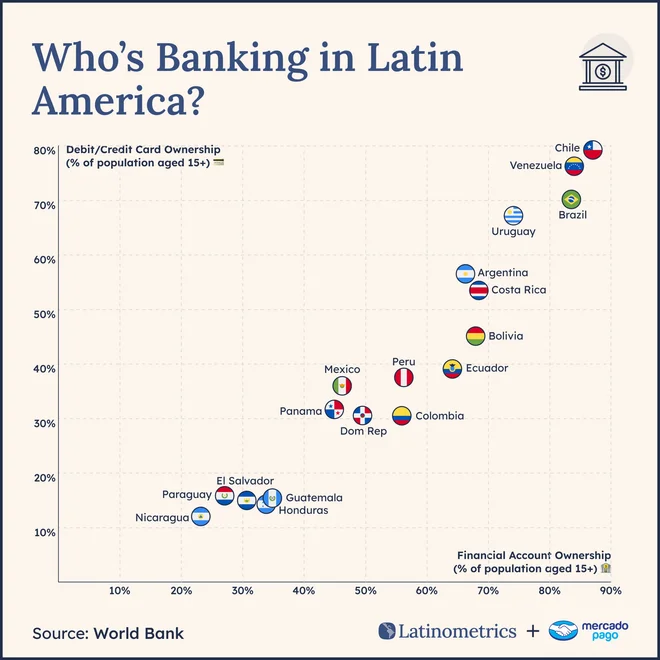
Mercado Pago goes from payments app to banking force
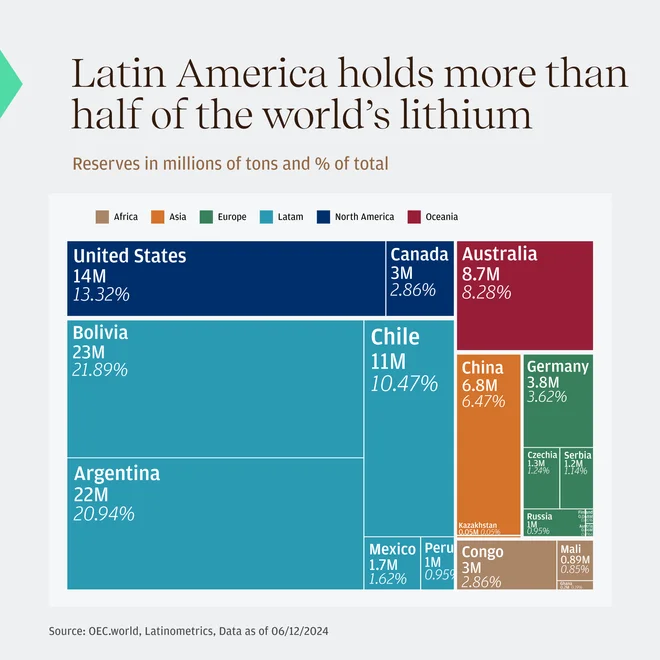
JP Morgan elevates its private bank expertise
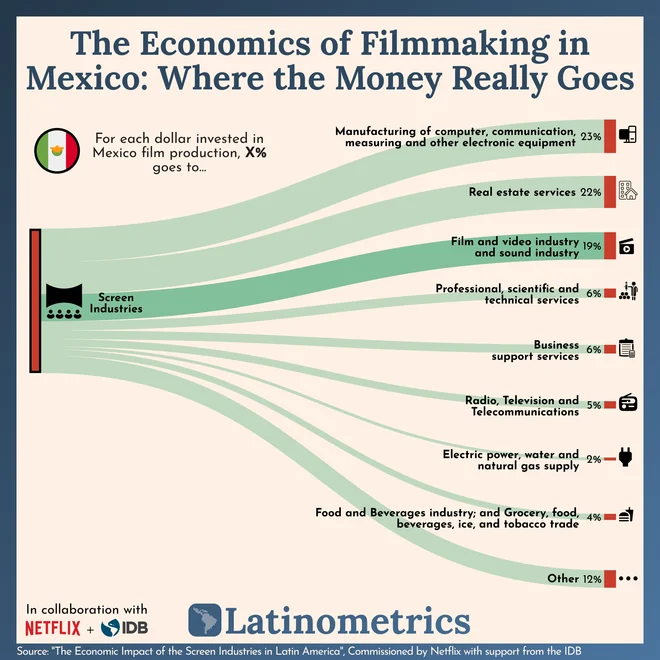
Netflix & IDB influence culture with film industry economics
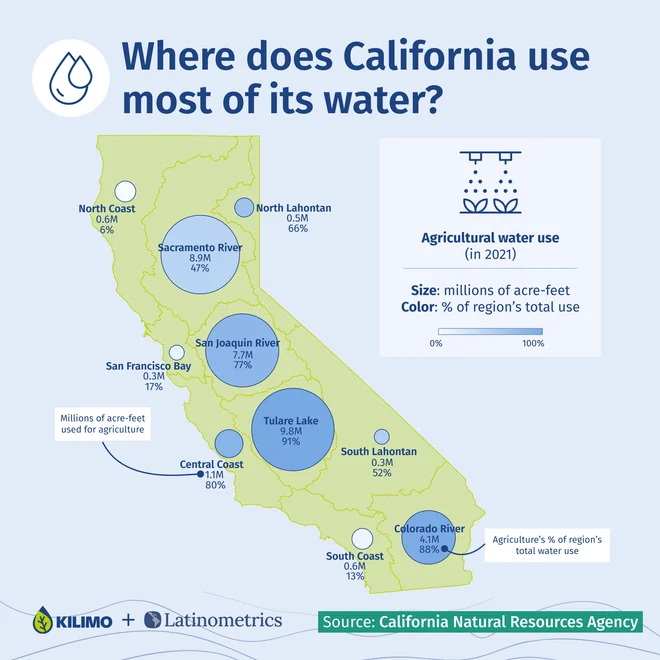
Kilimo wins policymakers with water conservation insights
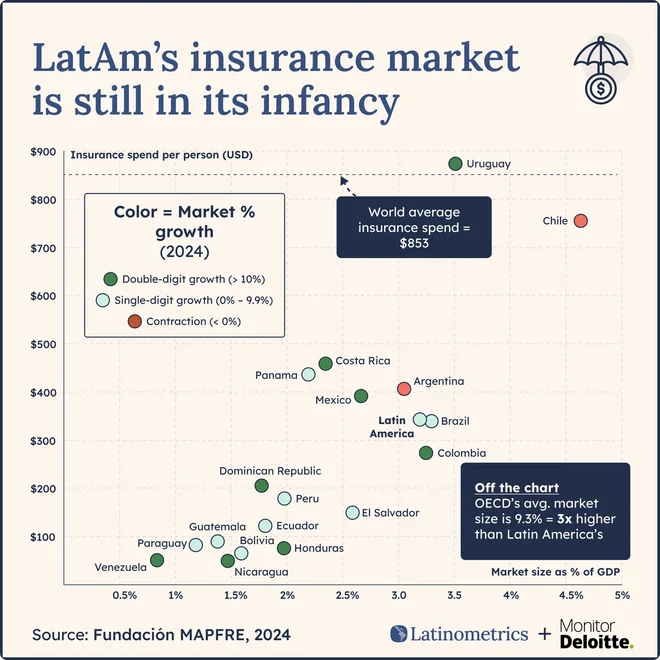
Monitor Deloitte reaches Mexico's banking executives
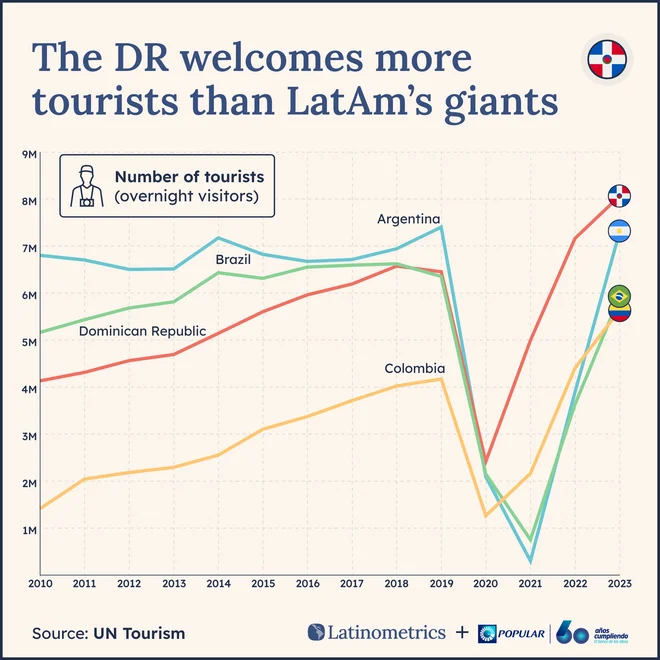
Banco Popular earns trust for big investments by telling the story of DR's tourism sector
Rented reach expires. Owned stories compound.
If you budget for ads, PR, or research reports, you already believe in reaching this audience. The difference is what each dollar leaves behind a year later.
Fuel, not an asset.
Paid reach works, and we use it too. But impressions rented without a story behind them stop the day the budget does.
You are a quote in someone else's story.
The journalist keeps the framing. The aspiration is to get cited, not just mentioned.
Rigorous, unread.
Months of work becomes a PDF that never leaves the archive. Nobody shares page 47.
Own the asset. Keep it working for years.
We create the data stories with your team's expertise and publish them to 360K+ followers, 67.4% of our LinkedIn following senior-level or above. You keep full rights to every chart, forever: sales decks, press events, investor materials.
One partner and one budget line, creation and distribution included.
Your expertise, amplified
We turn a 60-minute briefing into data stories that reach 360K+ followers.
Your team's expertise is the raw material. We handle everything else.
Digestible, credible, shareable. Not a 100-page PDF nobody opens.
- 1 60 min
Interview
One call. You talk about what you know better than anyone. That is the only time we need from you.
- 2 We handle
Data + narrative
We source the data, verify it, and find the story in it.
- 3 We handle
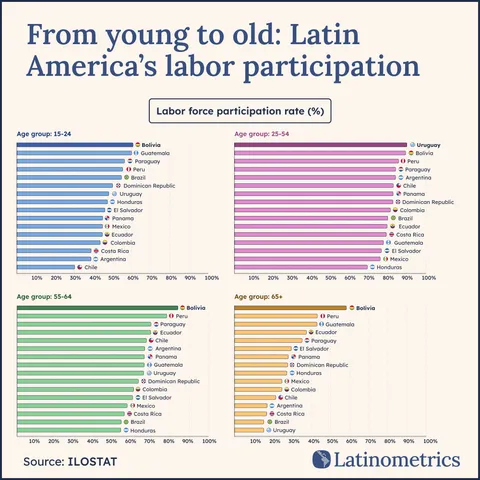
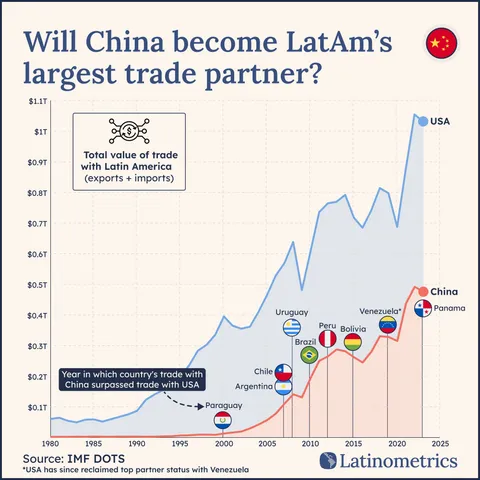
Design
Charts in the style the region's leaders already share. You approve before anything goes live.
- 4 2-3 weeks
Distribution
Published to 360K+ followers across LinkedIn, X, Instagram, Threads, Facebook, and our newsletter.
We adapt to how you work.
Some partners hand us a dataset and let us run. Others prefer close collaboration on every detail.
Either way, you retain full approval before anything goes live.
*All stories must be grounded in credible, verifiable data.
What it looks like in practice
Two campaigns, and what the clients said afterwards.
 418 leads from 2 campaigns
 Perspectivas Industriales
- 1 Industry 4.0 data stories built for Mexico, drawn from their own engineers' expertise.
- 2 It ran as an evergreen campaign, amplified through media outreach, their 60K-subscriber email blast, and 90 media contacts.
- 3 Then the same charts became the top of a lead funnel, targeted at the manufacturing decision-makers they wanted to meet.
The lead-generation half of that story, with the delivered cost per lead, lives on our B2B lead generation page.
 976K+ organic impressions
 Positioned as a bank, before the license
- 1 A five-chart deep dive delivered in three weeks, timed to their earnings.
- 2 It made the case for Mercado Pago as a "bank" in Mexico while they were seeking the license.
- 3 Their team then used the same assets to engage media at press conferences.
"We closed a major pipeline deal in Peru weeks after the content went live. It positioned us exactly where we needed to be."
 Cristina Valencia Rojas, VP of Comms
 "Our CEO started getting connection requests from potential clients within days of publishing."
 Lucia Machay, Communications Manager
 Brands we have published with












The audience behind that 68%
Your data stories reach the decision-makers who shape Latin America's business landscape.
Combined following
Five social platforms & the newsletter
C-level executives
CXO-titled on LinkedIn
Senior-level or above
Senior IC through C-suite
By Seniority
Share of all 169,163 LinkedIn followers. LinkedIn leaves 10.4% unclassified; we show that slice rather than dropping it.
By Industry
Share of the 143,793 followers with a listed industry, grouped from LinkedIn's 100 categories. No single industry exceeds 6.1%.
Primary markets: Mexico, Brazil, Colombia, Argentina, Chile, and the US-based LatAm diaspora.
Our audience is concentrated where LatAm business decisions are made.
Audience data as of 2026-07-25 · LinkedIn Analytics, beehiiv, and platform profiles. Newsletter: 28,301 active subscribers, 42.1% open rate (unique opens ÷ delivered, trailing 10 sends). Combined following sums LinkedIn, X, Instagram, Threads, Facebook, and the newsletter, and counts anyone who follows on more than one more than once.
The 68% figure is the pooled engagement rate of CXO-titled versus entry-level viewers on our sponsored LinkedIn campaigns (flights through 2026-08-07, 139,674 CXO and 1,069,035 entry-level impressions across the 11 campaigns that served both). Engagement rate is LinkedIn's own definition, inclusive of clicks.
Three ways to work together
Choose the option that fits your goals and budget
Test
$4,500
What you get
1 co-branded data story + social media kits
Expected reach
100K–300K impressions
Best for
Testing fit, validating the approach
Example
"State of Fintech Inclusion in LatAm"
Build
$25K
What you get
4-6 piece campaign + full distribution
Expected reach
500K–1.5M impressions
Best for
Events, launches, market entry
Example
"LatAm Nearshoring Report—5-chart series with executive summary and press assets"
Scale
$25K+
What you get
Ongoing content + distribution + lead capture
Expected reach
Consistent executive presence
Best for
Always-on thought leadership
Example
"Become the reference your industry learns from, with 8-12 pieces/year and priority distribution"
All options include
Here to fill a sales pipeline, not build a narrative? See our B2B lead generation service.
Questions buyers ask
Everything you need to know before we talk
What if we already have a content agency?
Great—we're not here to replace them. Content agencies create excellent material, but distribution is a different skill set. We're a distribution partner with content capabilities. Many clients use their agency for brand content while we handle thought leadership that requires guaranteed reach to decision-makers.
How do I prove ROI to my CFO?
We provide engagement metrics, reach data, and lead attribution for every piece. More importantly, we help you frame thought leadership as a multi-use asset: the same content gets used in sales decks, investor materials, PR, and internal communications for 12-18 months. One piece, many applications—that's the ROI story.
How does this compare to sponsoring WSJ or Bloomberg?
Sponsoring major media gives you impressions for a week. We give you ownership of the narrative plus 2-5x the engagement at a fraction of the cost. A $50K WSJ sponsorship gets you one week of visibility. $25K with us gets you 5+ pieces of content you own forever, distributed to a 360K+-strong audience that engages at rates traditional media can't match.
How much time does this require from our team?
60-90 minute strategy session. We handle everything else—research, data, design, distribution. You approve before publication. Some partners prefer close collaboration; others hand us a dataset and let us run. We adapt to how you work.
How long does each piece take?
2-3 weeks from kickoff to publication. We've streamlined our process to move fast without sacrificing quality.
Do we own the content?
Yes—full commercial license upon completion and payment. You can use it however you want, forever. Sales decks, investor presentations, website, social media—it's yours.
Can you work with our compliance/legal team?
Absolutely. We've navigated J.P. Morgan's approval process and work regularly with legal teams at financial institutions. We know how to get content approved.
So, is it a fit?
You'll enjoy working with us if:
- You sell B2B
- You want to be the brand your industry learns from
- You let the data speak for itself
You won't enjoy it if:
- You're chasing a one-off viral post
- You see content as a cost to minimize
- You'd rather the data fit your narrative
If the first list sounds like you, let's talk!
See if we're a fit
Here's what happens:
No pitch deck. No pressure. No obligation.