🗽 Latino Demographics
US Latinos, a fifth of the population, produce nearly $4T in economic output.

In 1892, an immigrant processing station was opened on Ellis Island, in New York Harbor. This station processed over 12M people arriving to the United States over the course of six decades. Today, it’s believed that about 40% of Americans can trace their lineage back to an immigrant who went through those station doors.
Walk through the Ellis Island National Museum of Immigration and you’ll learn about the different waves of immigration in US history, including the Germans in the 1800s, Irish and Italians in the early 1900s…and the Latinos ever since.
Mexican Americans, for example, make up the second-largest group by national origin in the US behind only German Americans. Including both first-generation immigrants as well as Chicanos and members of the Mexican diaspora, they number over 35M nationwide and are especially concentrated in the US southwest in border states such as California and Texas.
Cross the country, and the picture is a little different. New York City has long been a popular destination for Dominicans fleeing dictatorships like the Trujillo regime (1930–1961) as well as unemployment, inflation, and political repression.
Some would argue that Dominicans’ eventual dominance in New York, especially in Uptown Manhattan and the Bronx, is only fitting, given that the first non-native person to live on Manhattan Island in what would eventually become NYC was Juan Rodriguez, from Santo Domingo.
Nationally, Dominicans number behind only Mexicans, (stateside) Puerto Ricans, Cubans, and Salvadoreans in terms of population.
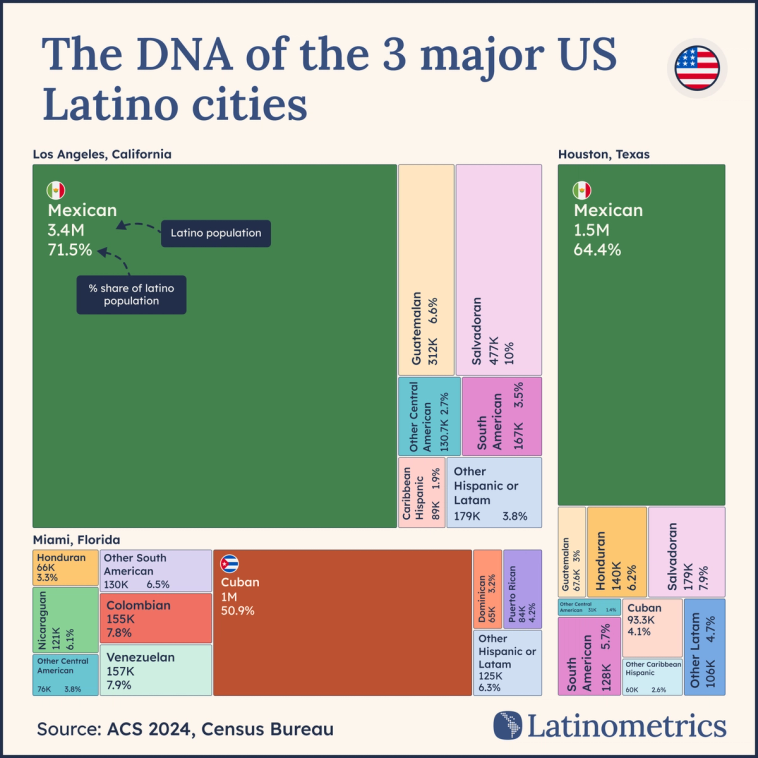
What New York and the surrounding area is to Dominicans is what the Miami region is to Cubans. Miami-Dade County, the most populous Hispanic-majority county in the country, is home to 52% of all Cuban immigrants in the US, making the Southern Florida area the center of gravity for Cuban emigres.
This has had a profound impact on the area’s culture and demographics, seen in everything from the nearly fully-Hispanic Miami suburb of Hialeah to current US Secretary of State Marco Rubio. Much like their Dominican counterparts, Cubans really began arriving en masse beginning in the 1950s-1960s, after the Cuban Revolution.
Seventy years after these early arrivals and the closure of the Ellis Island station, the Hispanic community in the US faces broad new challenges. Today, however, the 65M US Latinos represent the country’s immigrant credentials better than perhaps any other group, making up a fifth of the national population and producing nearly $4T in economic output.


