
📈 12 Months = 12 Charts


Welcome to Latinometrics. We bring you Latin American insights and trends through concise, thought-provoking data visualizations.
If you haven’t already, consider getting a paid subscription to:
1. Receive the most though-provoking, original content in our region
2. Stay ahead of trends, and
3. Support data-based journalism
Upgrade
Thank you for a great 2024. We’ve been Visualizing Latin America’s Potential for 3 years now. We’ll be taking a break (as should you, if you can) for the next two weeks, but in case you’re itching for some data stories, here are the charts that made the most noise on social media each month this year.
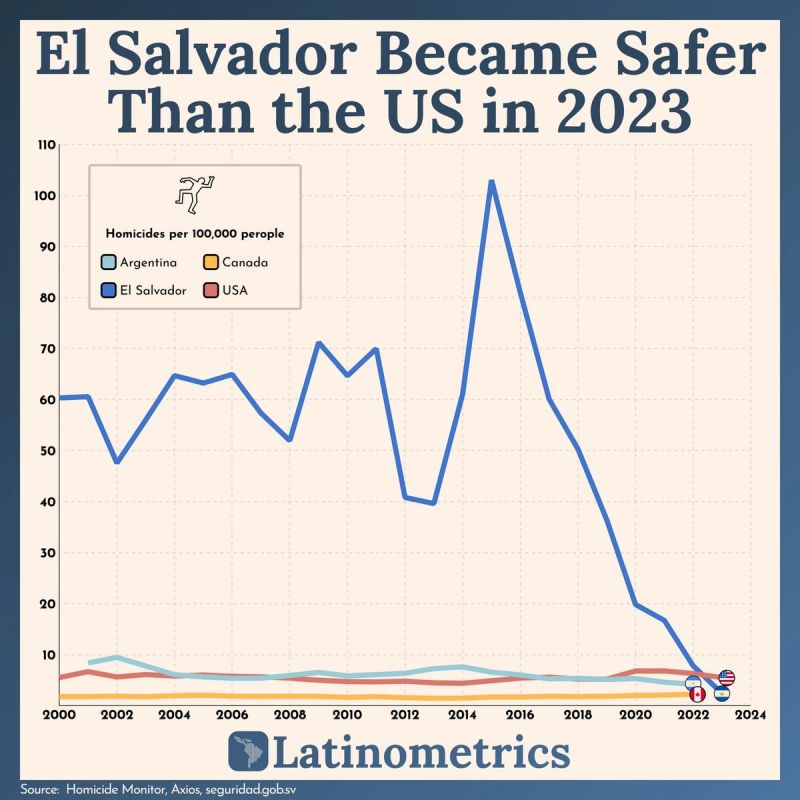
January 🔪
"It's tough to argue against mano-dura policies, given they mean thousands of fewer lives are taken by violence each year."
El Salvador Became Safer Than the US in 2023
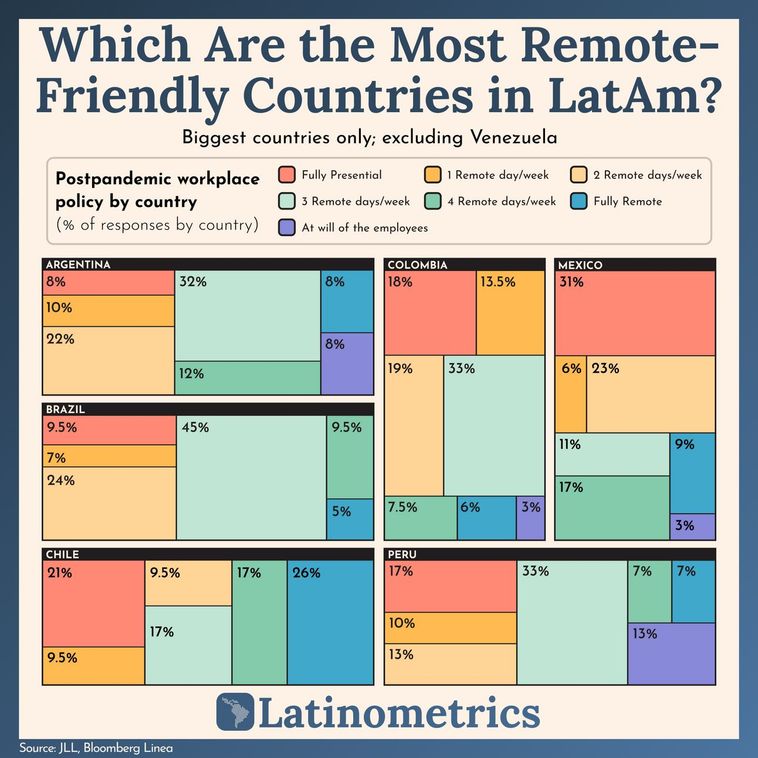
February 🧑💻
"No matter what your work setup is, the shift towards more flexible arrangements reflects our collective craving for balance—blending productivity with the personal touch that only face-to-face interactions can provide."
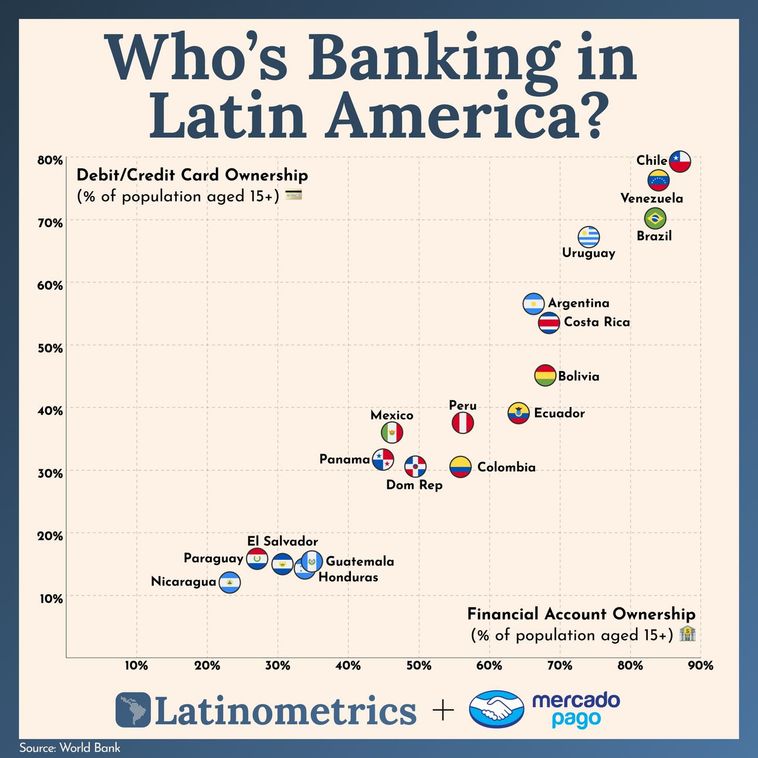
March 💳
"With range like this, it’s evident that there’s nothing if not opportunity in the region for nontraditional players to make a big splash in the banking industry."
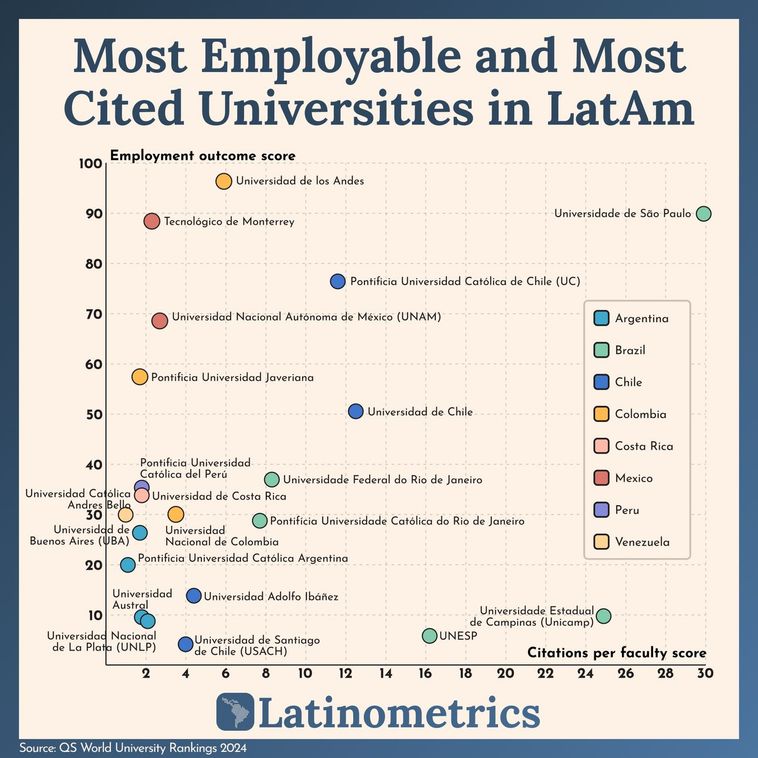
April 🎓
"USP - Universidade de São Paulo and the Universidad Nacional Autónoma de México (UNAM) are LatAm's best universities, with a level of academic excellence deserving of the sprawling metropolises that host them."
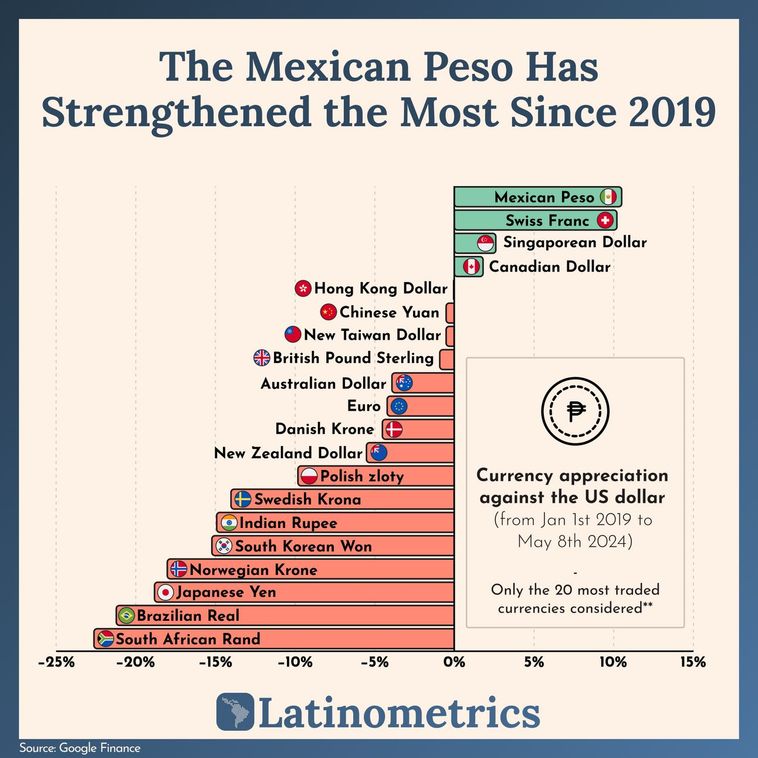
May ₱
"In the past five years, the Mexican peso has appreciated the most out of the 20 main currencies in circulation, even beating the Swiss franc by a small margin."
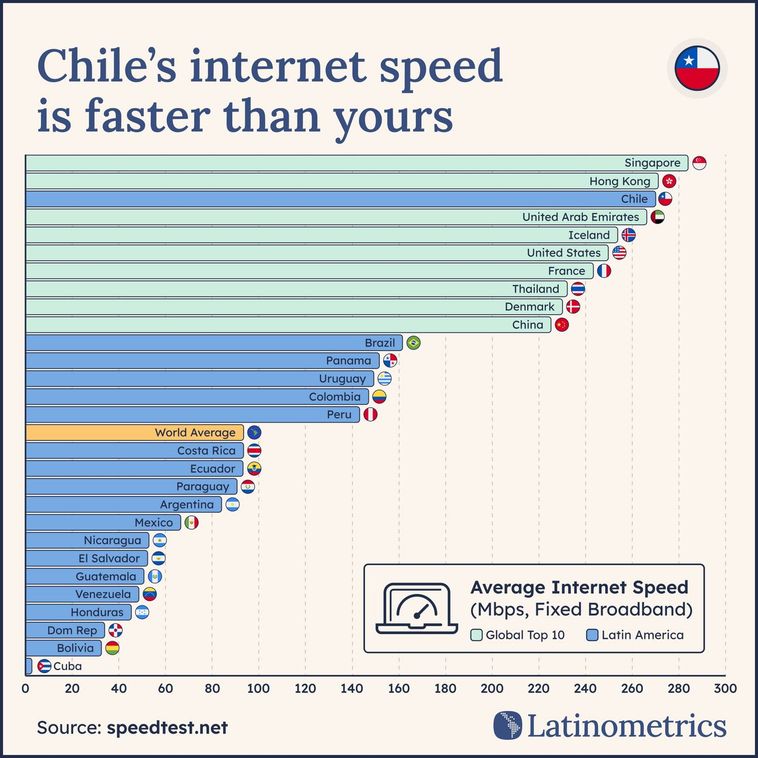
June (notice something different?) 🛜
"Fiber optic has been installed throughout the country, providing reliable Internet access at roughly 200% the global average speed."
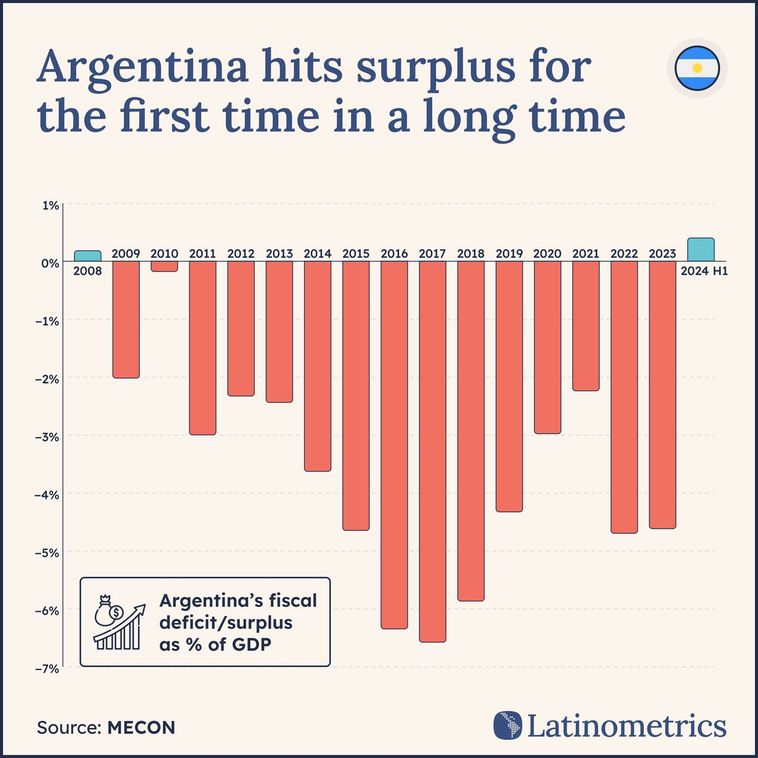
July 🇦🇷
"This year saw the first budget surplus in over 15 years, reflecting a concrete victory given the dangers of running long-term fiscal deficits."
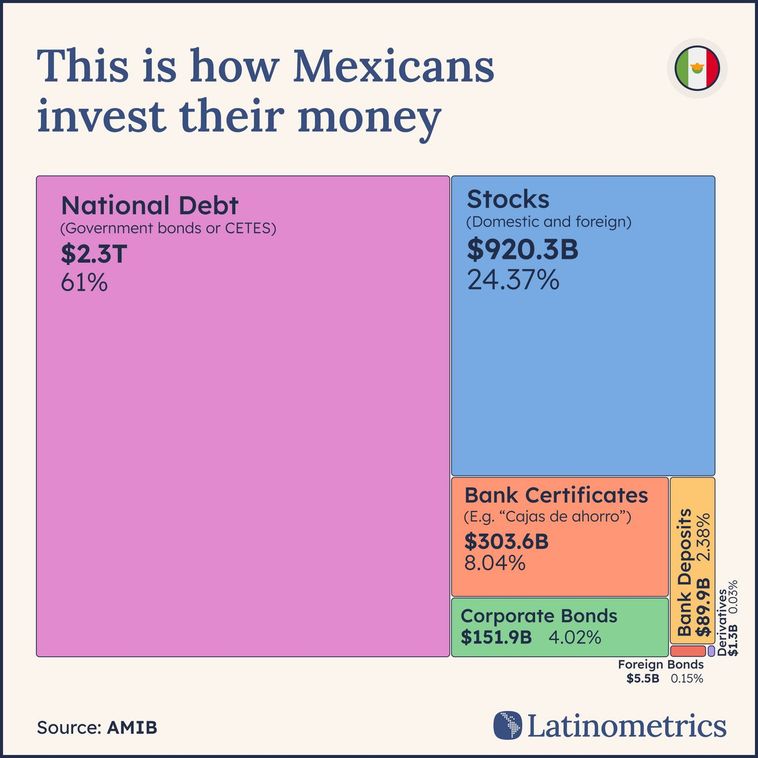
August 🇲🇽
"In 2015, less than 1% of Mexicans held an investor account; fast forward less than a decade and you see over 13%, reflecting a massive shift in just a few short years."
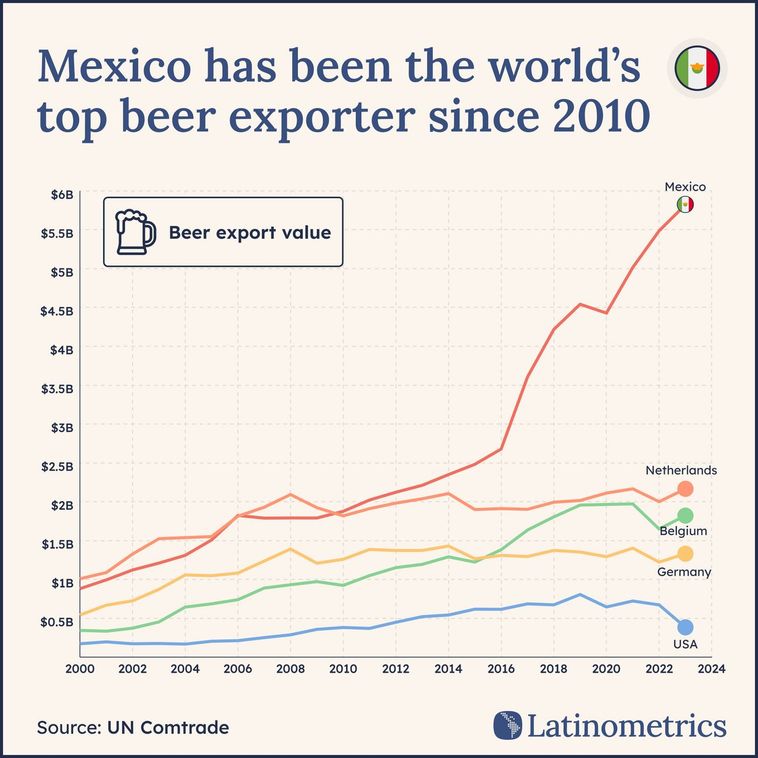
September 🍻
"Mexico's beer exports are on fire, reaching nearly $6B and counting in revenue last year, leaving historical European beer powerhouses entirely in the dust."
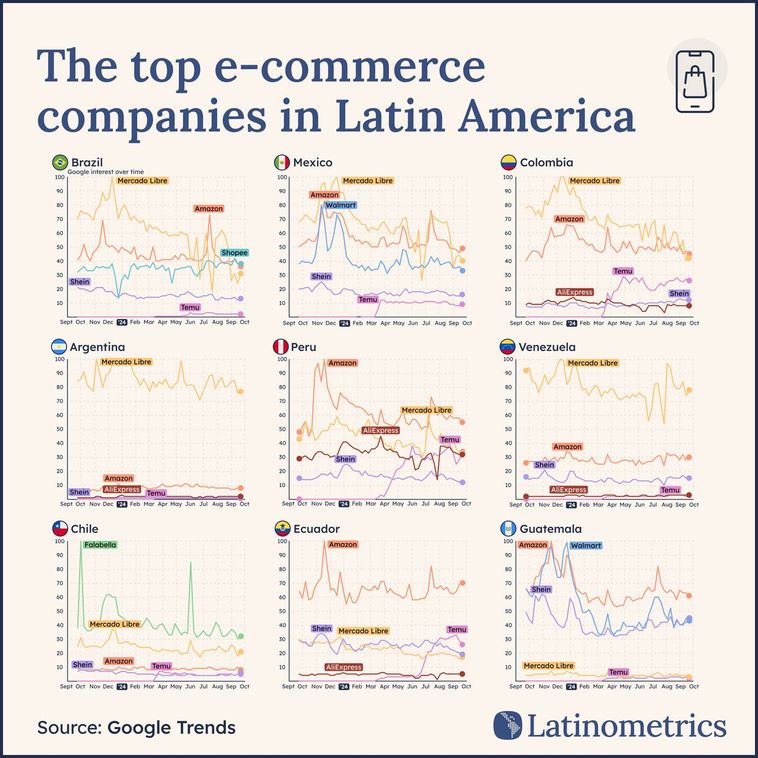
October 🛍️
"Try Mercado Libre (MELI), the e-commerce giant out of Argentina, which today has a market cap of over $100B."
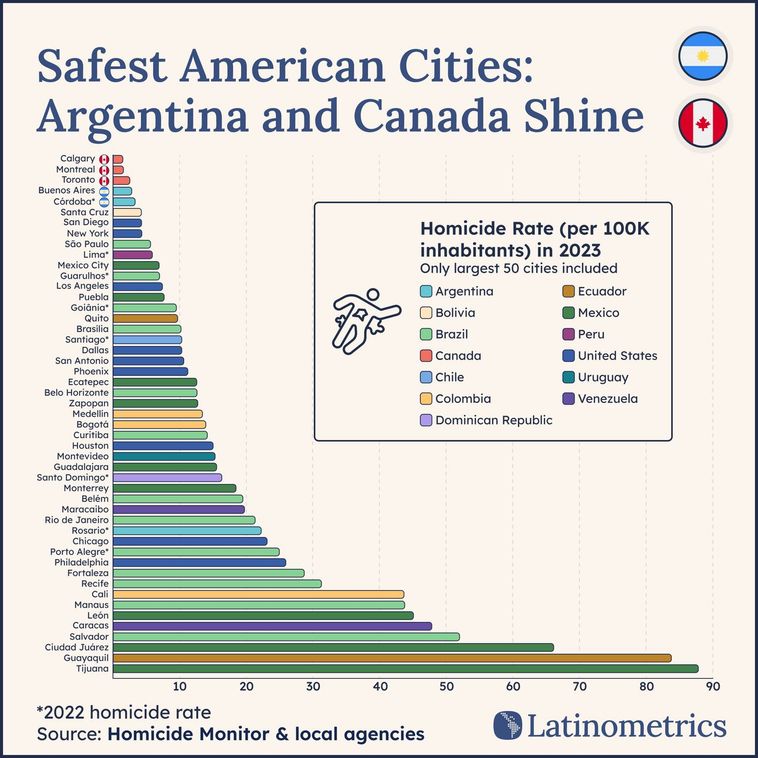
November 🕊️
"Even Rio de Janeiro has an overblown reputation for danger, particularly as the carioca capital has made massive advancements since the 1990s and today sees a lower homicide rate than both Chicago and Philadelphia."
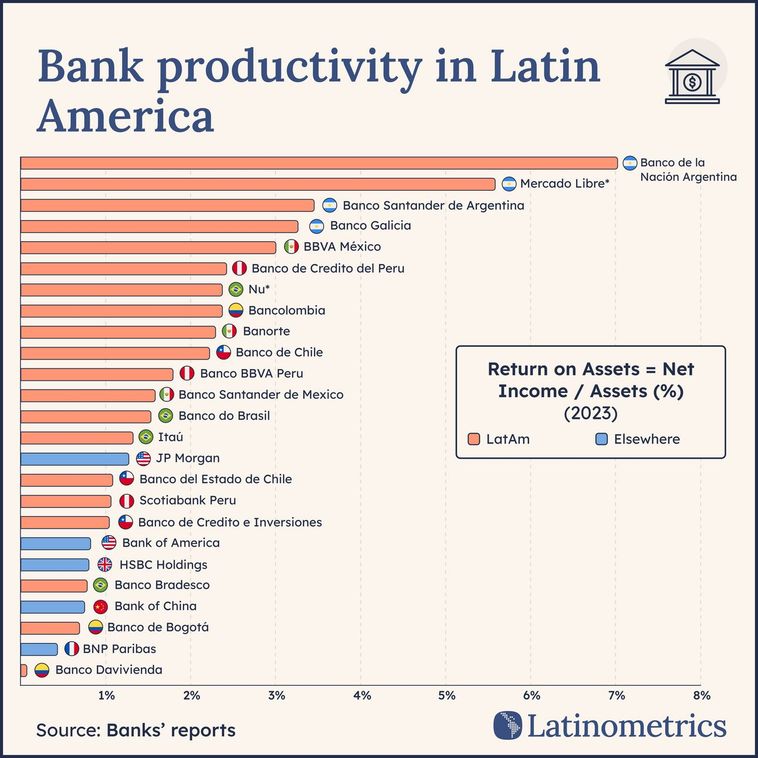
December 🏦
"Banco de la Nación greatly protected itself against inflation in 2023 by holding US dollars."
On behalf of everyone at Latinometrics, may you end 2024 with many blessings. Get some rest and start 2025 ready to Realize Latin America’s Potential.
Upgrade


